

Charts using Chart.js


Dashboard contains a lot of datas and it can be quite overwhelming visually. To give them more legibility and clearer look, it is essential to choose the right kind of charts and optimize them for the design and of course along with a good layout.
On this dashboard, I used Chart.js. Chart.js is one of the most popular charting libraries. I chose several chart types according to the data and modified various attributes of each so that they could intergrate into my layout and design harmoniously.

To convey the complicated data comprehensively, it is a key to choose the right chart depending on the nature of data. I applied Doughnut/Pie chart , Bar chart, Line Chart, Bubble Chart, and bar & line mixed chart.
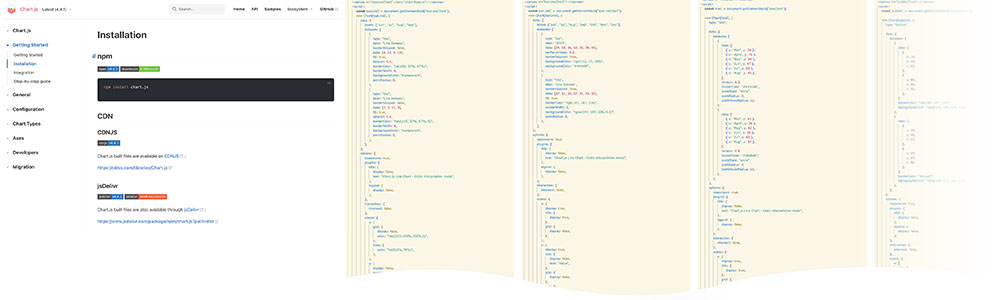
Chart.js provides numerous options to modify the design, hence, with a while of researching and digging on the Chart.js website, I could modified the design as I desire.

Responsive design is always crucial and Chart.js of course works well on mobile. For the mobile screen, I tweaked the layout and the size of each design element using CSS media query.